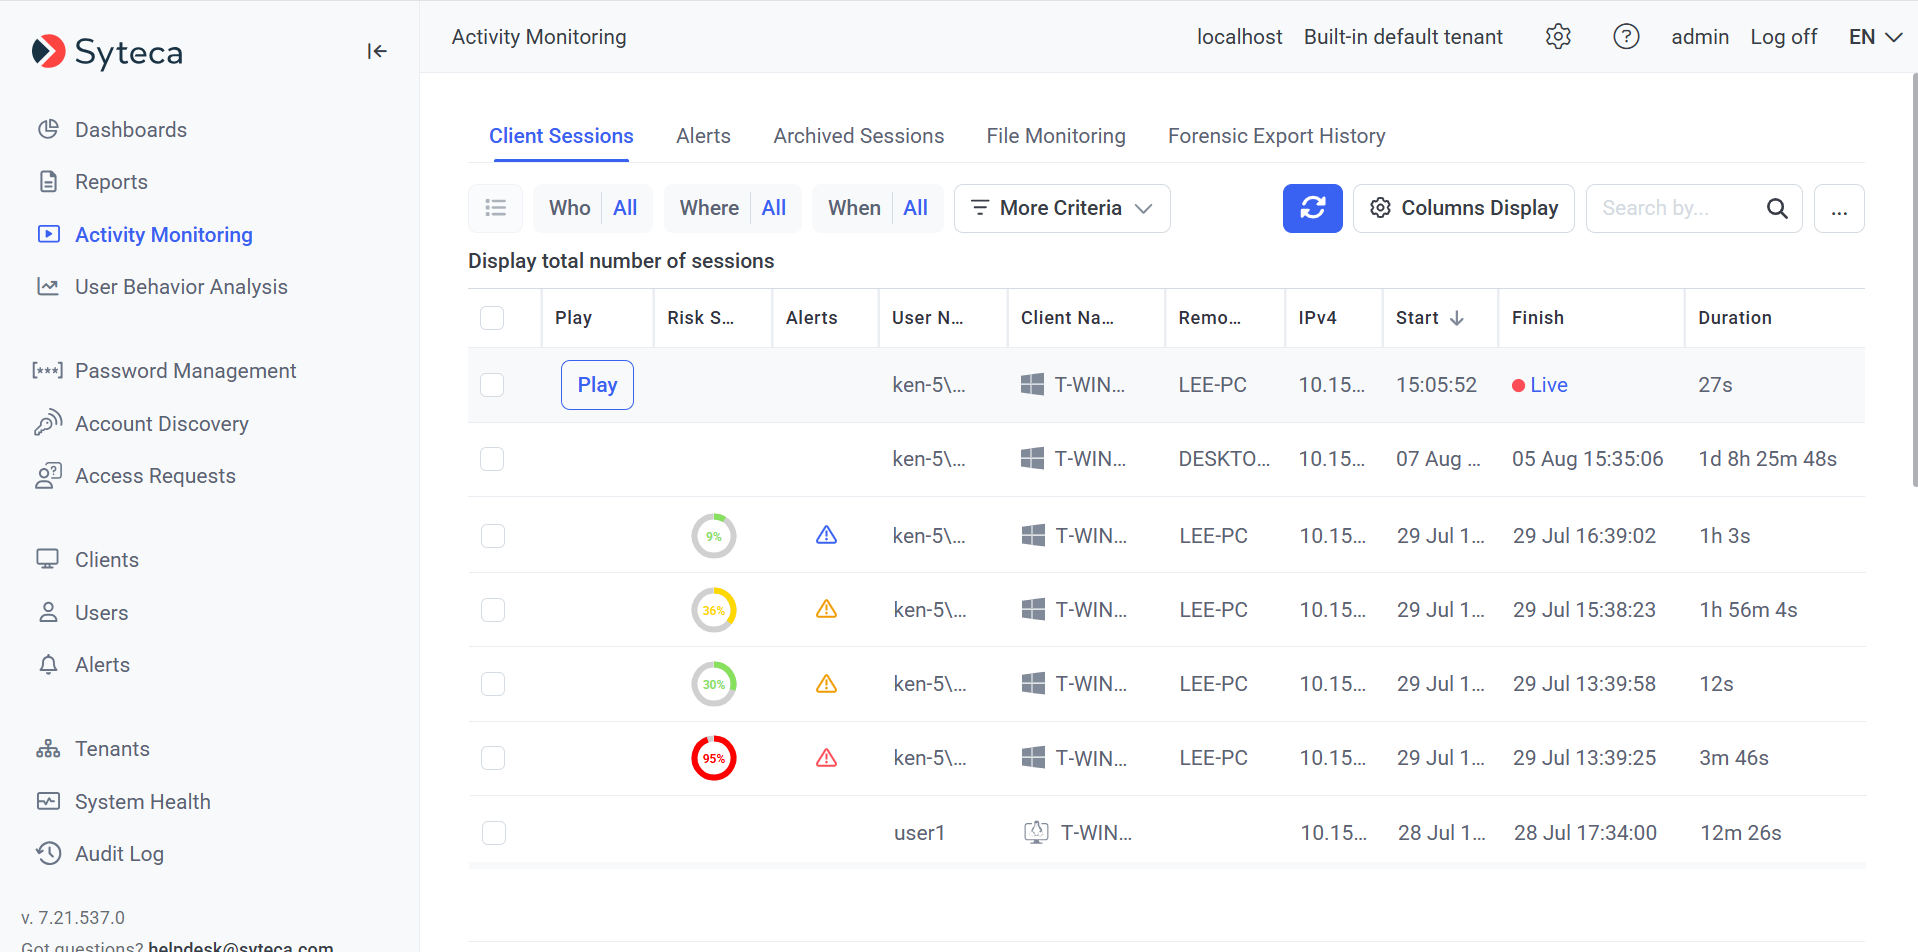
The Management Tool Interface
The Main Menu navigation pane is displayed on the left of the Management Tool interface, and allows navigation between the various main pages of the Management Tool. It consists of the following navigation links which open the associated pages in the main pane of the Management Tool interface:
• 

• Dashboards: Displays the page on which the user can view and analyze statistics data on various measures of user productivity in the form of convenient, interactive and individually-customizable charts.
• Reports: Displays the page on which the user can generate a report of the required type by defining parameters, and then save or print it. On the Scheduled Reports tab, the user can view and manage report generation rules, and view rule logs.
• Activity Monitoring: (previously called Monitoring Results): Displays the page on which the user can view the list of all Client sessions received from Clients that the user has the administrative Viewing Monitoring Results permission for, and export these sessions.
• NOT AVAILABLE IN SAAS User Behavior Analysis: Displays information about user behavior rules and user profiles for carrying out User Behavior Analytics (UEBA).
• Password Management: Displays the page on which the user can manage PAM (Privileged Access Management) secrets.
• Account Discovery: Displays the page on which the user can add and run account discovery rules to scan the network to find privileged accounts, and then onboard the accounts found into PAM (Privileged Access Management) secrets, and is available to users who have the administrative Privileged Accounts Management permission.
• Access Requests (previously called Access Management): Displays the page on which the user can manage two-factor authentication, one-time passwords, endpoint access control, etc.
• Clients (previously called Client Management): Displays information about all Windows Clients, macOS Clients, and Linux Clients in the system, where the number of Clients displayed on this page depends on the permissions granted to the user logged in to the Management Tool. From this page, the user can also navigate to the Blocked Users list.
• Users (previously called User Management): Displays information about all users in the system, and is available to users that have the administrative User Management permission.
• Alerts (previously called Alert Management): Displays information about alerts assigned to Clients.
• USB Devices (previously called USB Monitoring): Displays a list of all USB monitoring rules for all the Clients in the system, and is available to users having the administrative Client Installation and Management permission.
• NOT AVAILABLE IN SAAS Tenants: (previously called Tenant Management): Displays information about tenants, and allows new tenants to be added, and existing ones to be edited and deleted.
• System Health (previously called Health Monitoring): Displays information on the system state and resource usage on the Application Server computer for users of the built-in default tenant that have the administrative Tenant Management and System Configuration permission. It also contains information on disconnected Clients (on the Offline Clients tab), and tasks which may take significant time to process (on the Tasks List tab).
• Audit Log: Displays information on all user actions performed in the Management Tool.

The Configuration () button (at the top of the Management Tool interface) allows the Configuration page to be opened, where email sending settings, player link settings, system settings, log settings, ticketing system integration settings, LDAP targets, the date & time format, database management settings, etc. can be defined. This page also includes the following (default) tab:
• Serial Key Management: Displays information about the serial key and the licenses it contains, as well as activate/deactivate/update functionality for the serial key. It is available for users of the Administrators user group in Single-Tenant mode, and for users of the default tenant that have the administrative Tenant Management and System Configuration permission in Multi-Tenant mode.
Many of the main pages on the Management Tool interface also contain buttons and menus that allow basic actions to be performed to manage (add, edit, delete, etc.) Clients, tenants, users, alerts, rules, etc, which include for example:
• Clients: Add Client Group, Install Clients, Manage Licenses, Edit the Uninstallation Key, Uninstall Clients, Delete Clients, the Blocked Users list, and One-Time Passwords.
• NOT AVAILABLE IN SAAS Tenants: Add Tenant.
• Users: Add User and Add User Group.
• Alerts: Add Alert, Manage Multiple Alerts, Export Alerts, Import Alerts, and Global Alert Settings.
• USB Devices: Add Rule.
• Reports: Add Rule (on the Scheduled Reports tab).

