The Client Sessions List
To view (and manage) the monitored Client sessions, click the Activity Monitoring navigation link (on the left), and make sure the Client Sessions tab is selected.
The filters and the Search by box at the top of the page can be used to search the session data, and the Bulk Action (
Table of Contents
1. Viewing the Client Sessions
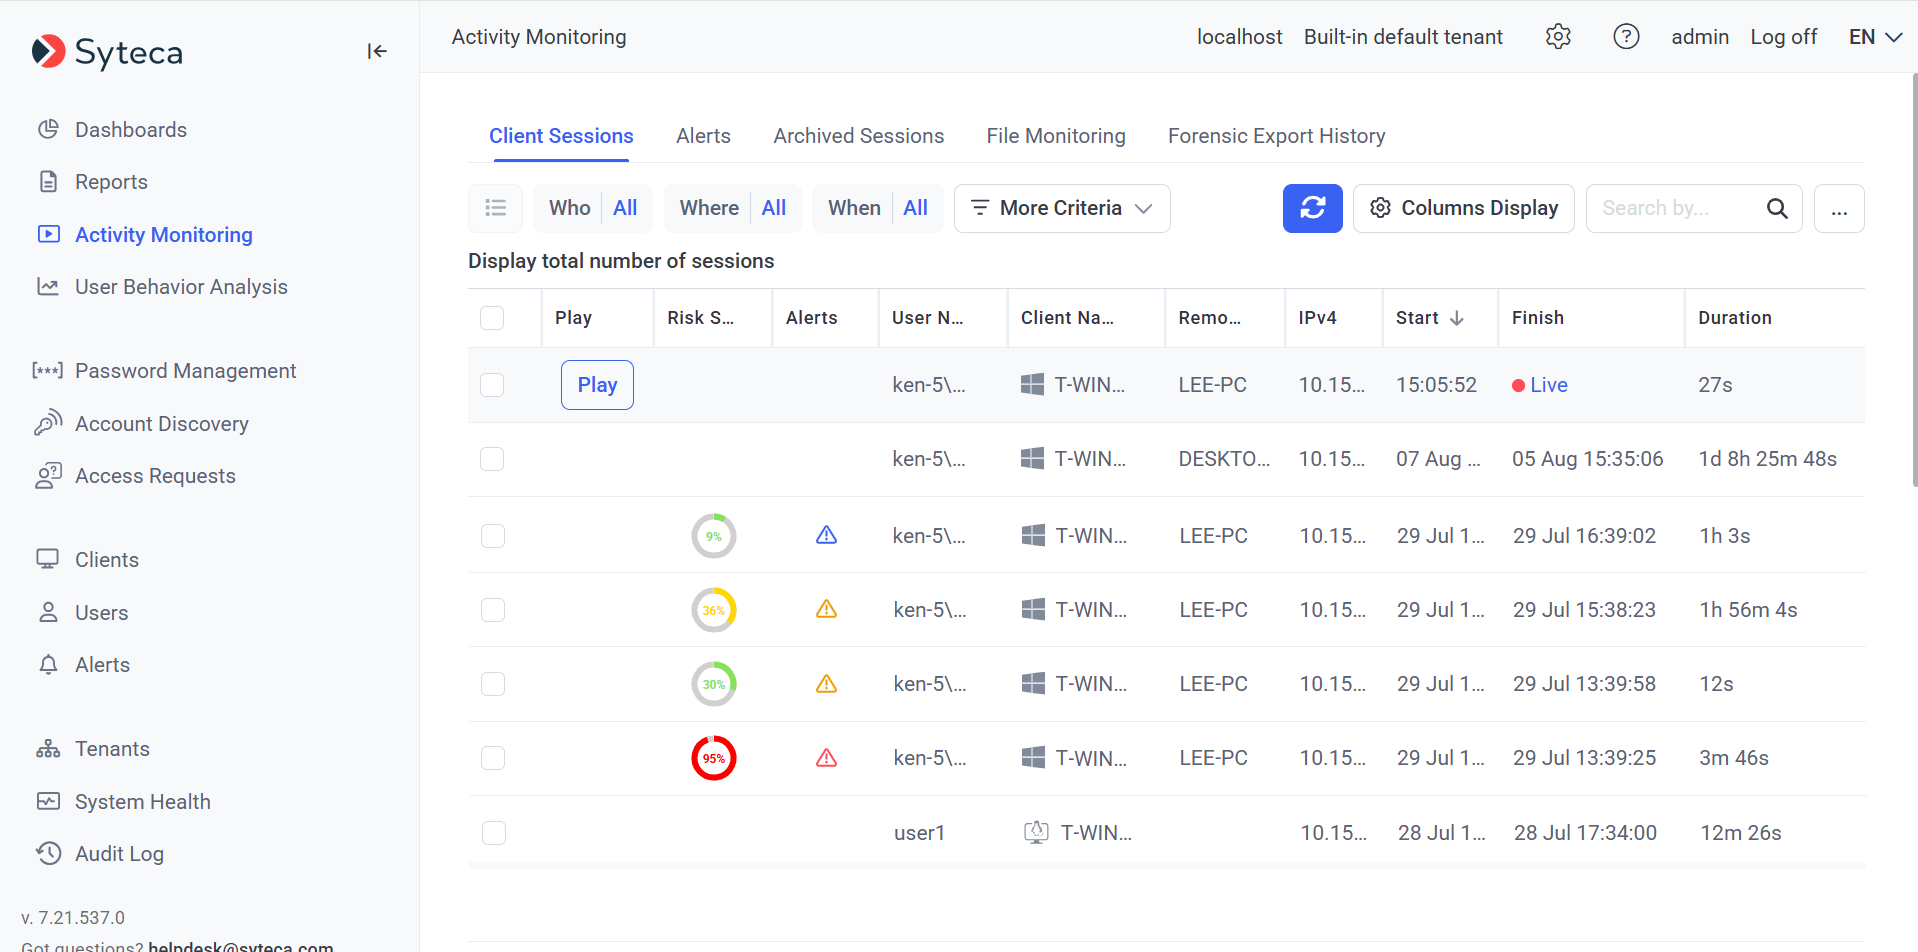
The list of all Client sessions is displayed in the form of grid, which displays the following information in the corresponding default columns (where the Total number of sessions listed is also shown at top of the page):
• 


• Play: The 
NOTE: The session can also be played by double-clicking anywhere on the session record.
• Alerts: If any alerts events (or USB monitoring rules) have been triggered in the session, an Alert icon in displayed, where the color of the icon corresponds to the highest alert risk level detected in the session:
- Alerts with the Critical risk level are indicated by a red (
- Alerts with the High risk level are indicated by an orange (
- Alerts with the Normal risk level are indicated by a blue (
• User Name: The name of the user logged36px3 in to the Client computer.
NOTE: If secondary user authentication is enabled on the Client, the User Name is displayed as: <Windows/Linux user logged in> (<secondary authentication user>), or if the use of one-time passwords is enabled on the Client, the User Name is displayed as: <Windows user logged in> (<user’s email address>).
• Client Name: The name of the computer on which the Client is installed (with the operating system type of the computer with the Client installed displayed as an icon to the left of the computer name).
• Remote Host Name: The name of the remote computer from which the connection to the Client computer is established.
• IP (toggle switch): The IPv4/IPv6 address of the Client computer.
• Start: The date and time when the session started.
• Finish: The date and time when the session finished (where the 
• Duration: The total duration of the session.
To update the sessions list, click the Refresh (
To sort the sessions in the list, click the required column header, and the column sort order can be changed from descending to ascending, or vice versa, by clicking the column header again, as indicated by the up/down arrow icon in the column header (where the session list can only be sorted by one column at a time).
NOTE: If the data cannot be sorted by a column, the up/down arrow is not shown in the column header after clicking on it.
To adjust the width of the columns, place the cursor over the separator between the required column headers, and drag and drop the separator left or right, as required.
To change the number of session records displayed per page, select the required option in the Results on Page drop-down list (in the bottom right of the page).
2. Managing the Columns Displayed
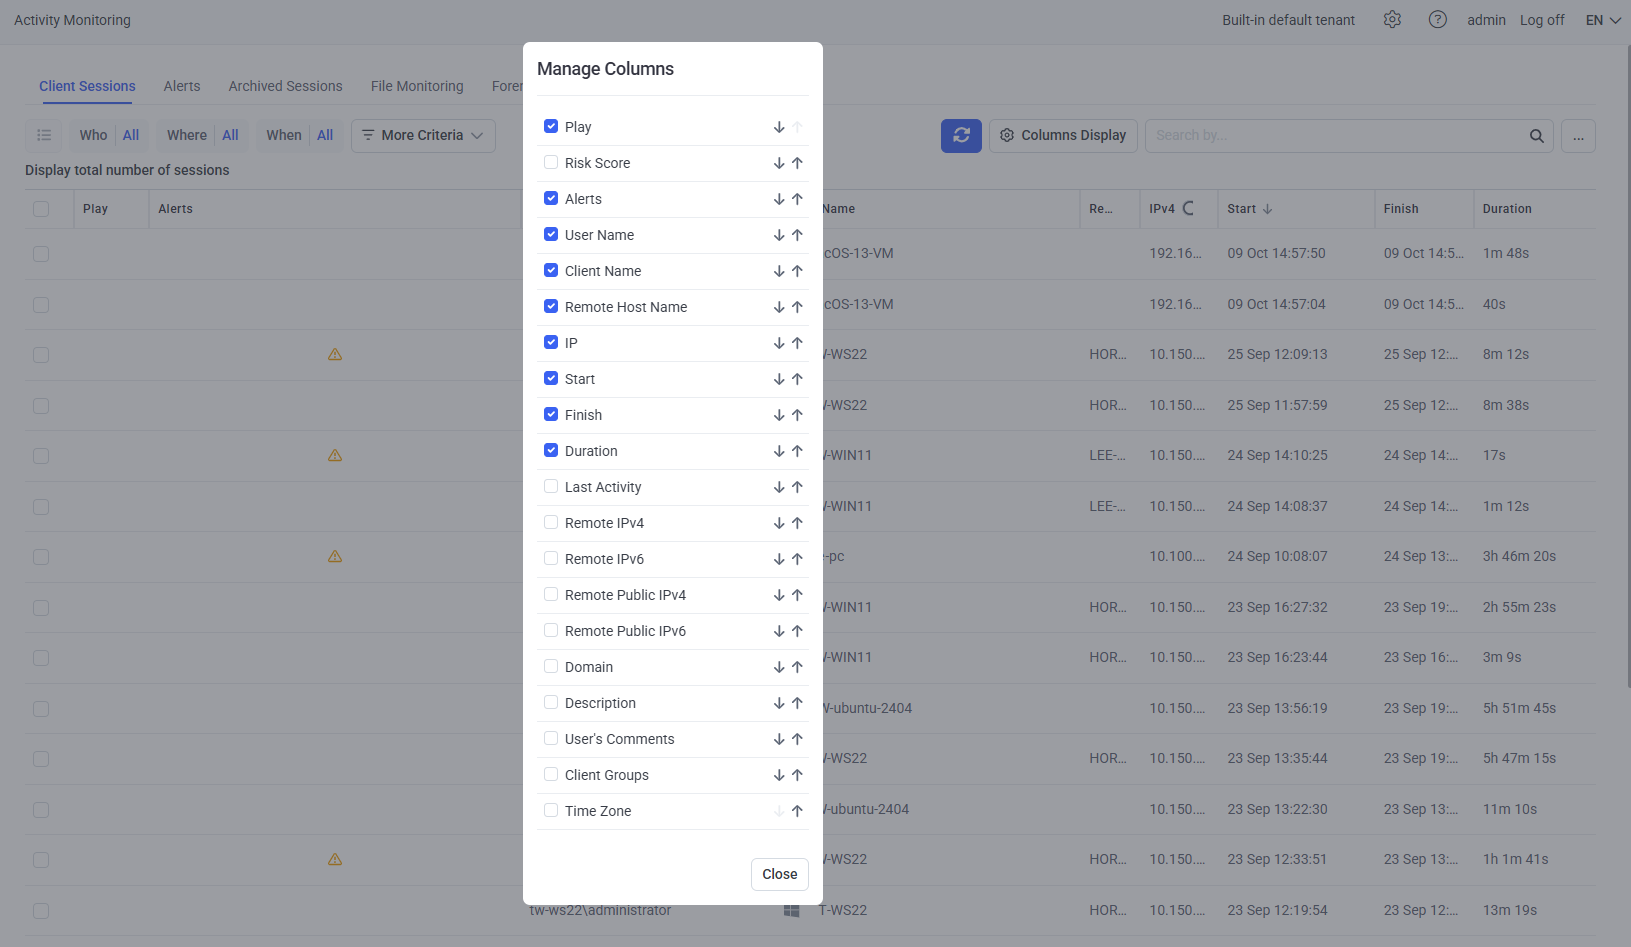
To add other columns to the grid (or hide columns, or change the order of the columns in the grid), click the Column Display button (at the top of the page), and in the Manage Columns pop-up window that opens, select the checkboxes next to the following column names to display them in the grid (and change the order in which the columns are to be displayed in the grid by using the up and down arrow icons), and then click the Close button:
• Risk Score: The severity level of the session is indicated by the risk score icon displayed, which can be clicked on to view the abnormal user behavior (UEBA) patterns and alert events detected in the session on the Session Risk Score page:
- Sessions with a Critical risk score are indicated by a red (
- Sessions with a High risk score are indicated by an orange (
- Sessions with a Normal risk score are indicated by a green (
• Last Activity: The date and time of the last screen capture / video frame recorded, or the last Linux command executed.
• Remote IPv4: The local IPv4 address of the remote computer from which the connection to the Client computer is established.
• Remote IPv6: The local IPv6 address of the remote computer from which the connection to the Client computer is established.
NOTE: If the user logs in to the Client computer remotely after the Client session has already started using one of the following remote desktop applications, the remote IP address will not be detected: DameWare, Radmin, UltraVNC, or TightVNC.
• Remote Public IPv4: The public IPv4 address of the remote computer from which the connection to the Client computer is established.
• Remote Public IPv6: The public IPv6 address of the remote computer from which the connection to the Client computer is established.
• Domain: The name of the domain to which the Client belongs.
• Description: A custom description of the Client.
• User's Comments: The user’s comment entered on login to the Client computer (or for remote Linux X-forwarded sessions: the text "x-forwarded app:" followed by the application name).
• Client Groups: The names of the Client groups to which the Client belongs (where if the Client only belongs to the All Clients group, the column is empty).
• Time Zone: The time zone of the Client computer, shown in UTC (Coordinated Universal Time), where if the time zone is changed, the current session ends and a new one is created.
NOTE: The Time Zone column is empty for sessions recorded before updating to the current version of Syteca.
3. Filtering and Searching the Sessions
To filter the sessions in the list (which can be filtered by multiple filters at once):
• Click the required filter (Who, When, or Where) at the top of the page, and specify the required filtering criteria.
NOTE: When filtering by the Who filter, the default value is to only display the first 1,500 session records. This value can be modified by adding the SessionsFilteredByUserMaxCount key to the EkranServer.Settings.config file and changing its value (specified as the number of sessions to be displayed, e.g. <add key="SessionsFilteredByUserMaxCount" value="10000" />) as required. The .config file can be found in the C:\Program Files\Ekran System\Ekran System\Server folder on the computer where the Application Server is installed.
IN SAAS ONLY: Since the EkranServer.Settings.config file is not available, please contact your Syteca vendor or the Syteca Support team to change the default value (of 1,500 session records) in your environment.
• Optionally, click the More criteria button to add additional filters to the top of the page (from the list of additional filters displayed).
To search the sessions in the list:
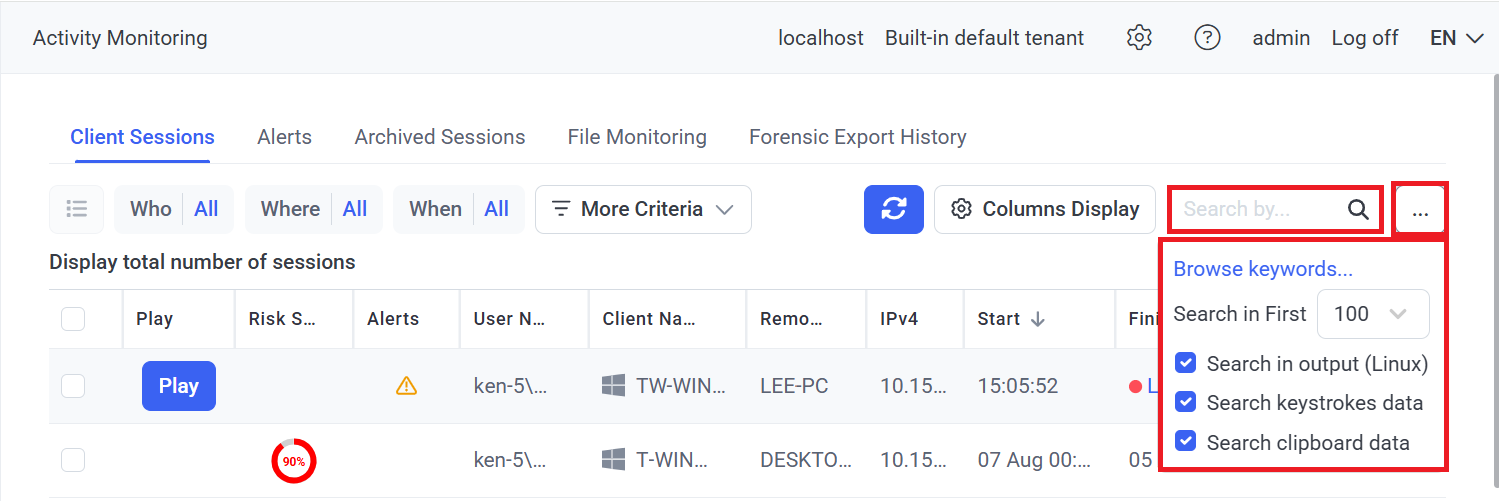
• Enter a keyword (or part of a keyword) into the Search by field (in the top right of the page), and then click the Search (
• Click the 
- Browse keywords: To upload a .txt file containing the search keywords (separated by semicolons).
- Search in First (10, 100, 500, 1000, or all sessions): To select the number of most recent sessions to search in.
- Search in output (Linux) checkbox: To include Linux command output response data in the search.
- Search keystrokes data: To include keystrokes in the search (only for Windows and macOS sessions).
- Search clipboard data: To include clipboard operations in the search.
4. Managing Multiple Sessions Simultaneously (Bulk Action)
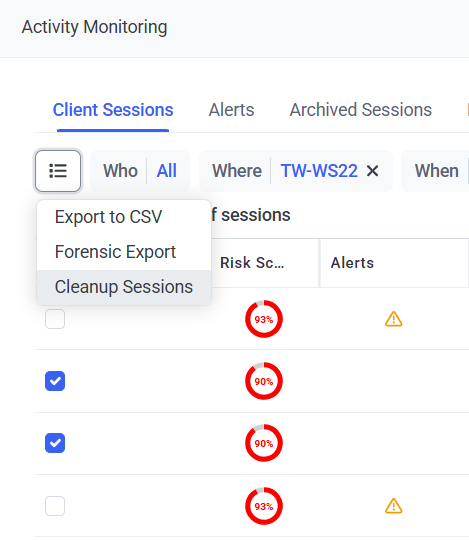
To manage multiple Client sessions simultaneously, the Bulk Action (
• Export to CSV: To export the sessions selected to a CSV file.
• Forensic Export: To perform a Forensic Export of the sessions selected.
• Cleanup Sessions: To perform a Cleanup operation on (i.e. delete) the sessions selected.
NOTE: Only the Cleanup operation (but not the Archive & Cleanup operation) is currently available for cleaning up selected sessions.
