Viewing Alerts Events
The Alerts tab (on the Activity Monitoring page) displays a list of all alert events, and thereby allows all alert event to be viewed in one place.
Whenever an alert (or USB monitoring rule) is triggered, a new record of the corresponding alert (or USB monitoring) event that occurred is added to the list displayed in the grid.
To be able to view the Activity Monitoring page, including the Alerts tab, a Management Tool user needs to have the administrative Viewing Monitoring Results permission.
NOTE: A Management Tool user can only view those alert events for which they have the relevant so-called "User-to-User" access permissions for, on the User Access tab (configured when editing/adding their Management Tool user or user group on the Users page).
The following information about each alert (or USB monitoring rule) triggered is displayed in the corresponding columns:
• 


• Play: The 
• Alert ID: The unique ID of the alert event.
• Risk: The risk level of the alert that was triggered (where the color of the alert icon corresponds to the alert risk level detected), as follows:
- Alerts with the Critical risk level are indicated by a red (
- Alerts with the High risk level are indicated by an orange (
- Alerts with the Normal risk level are indicated by a blue (
• Name: The name of the alert triggered.
• Description: A description of the alert.
• What: The user activity that triggered the alert.
• Who: The user name of the user who triggered the alert.
• Where: The name of the Client computer on which the alert was triggered.
• When: The date & time when the alert was triggered.
• Keywords: The value(s) defined in the alert rule(s) that triggered the alert.
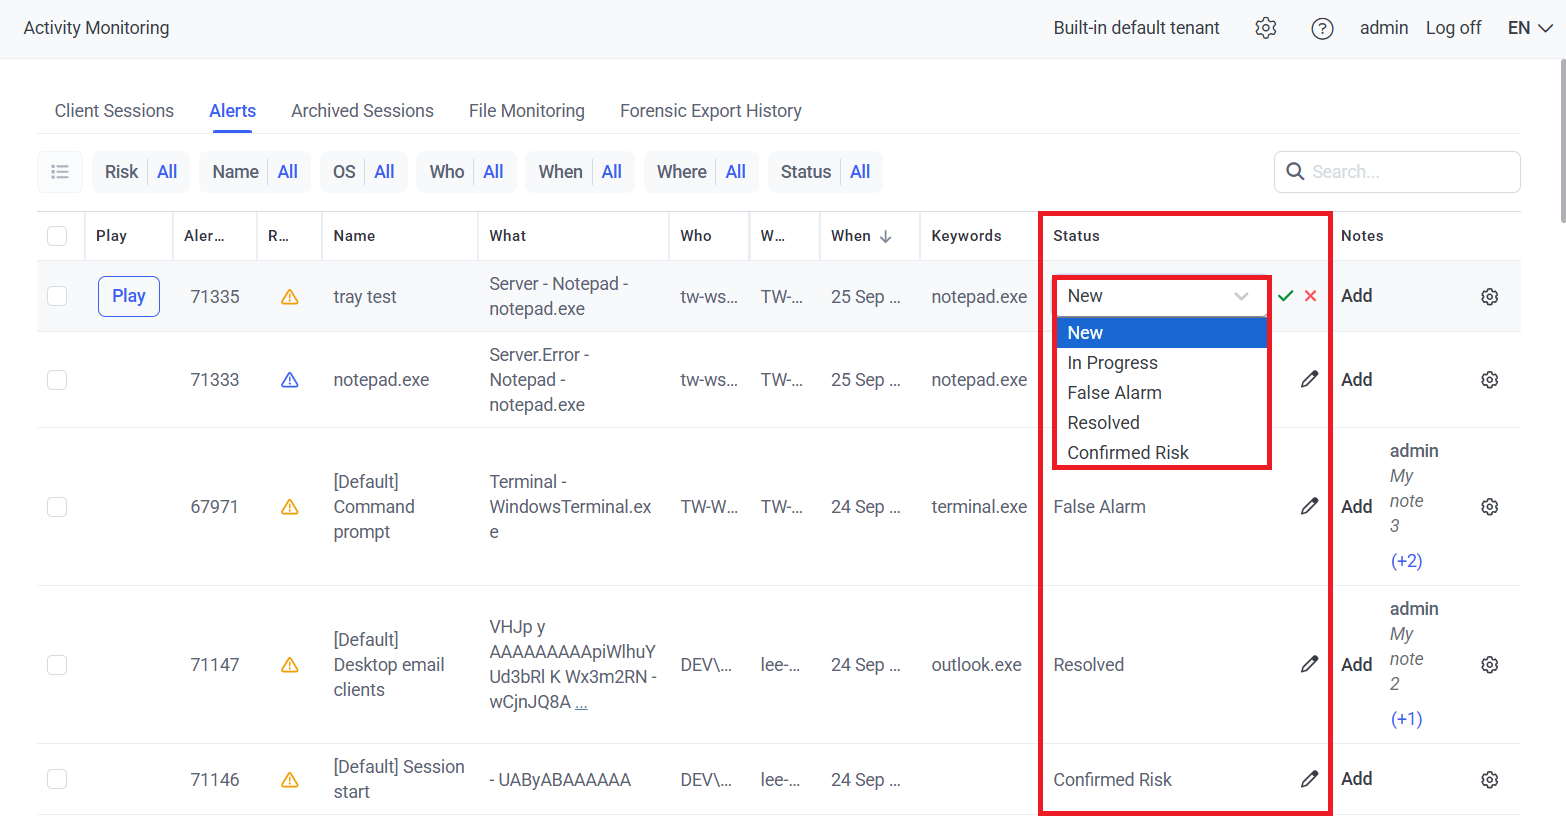
• Status: The status of an alert event (either Confirmed Risk / False Alarm / In Progress / New / Resolved, which can be changed by clicking the Edit (
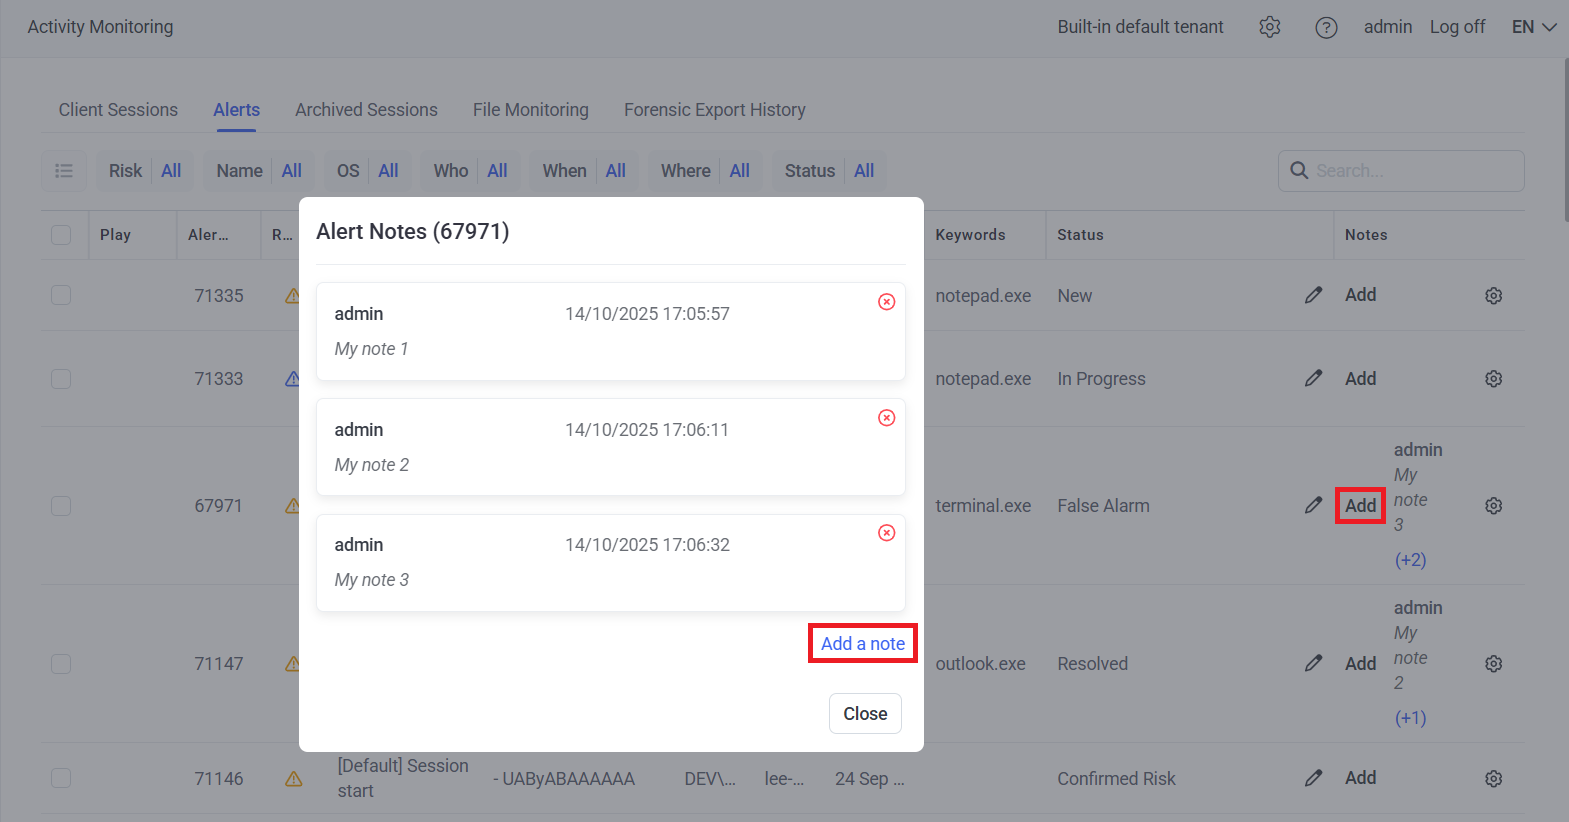
• Notes: The Add button next to an alert event can be clicked to add (or delete) notes (where the number of notes added is displayed in brackets e.g. "(+2)".
• 
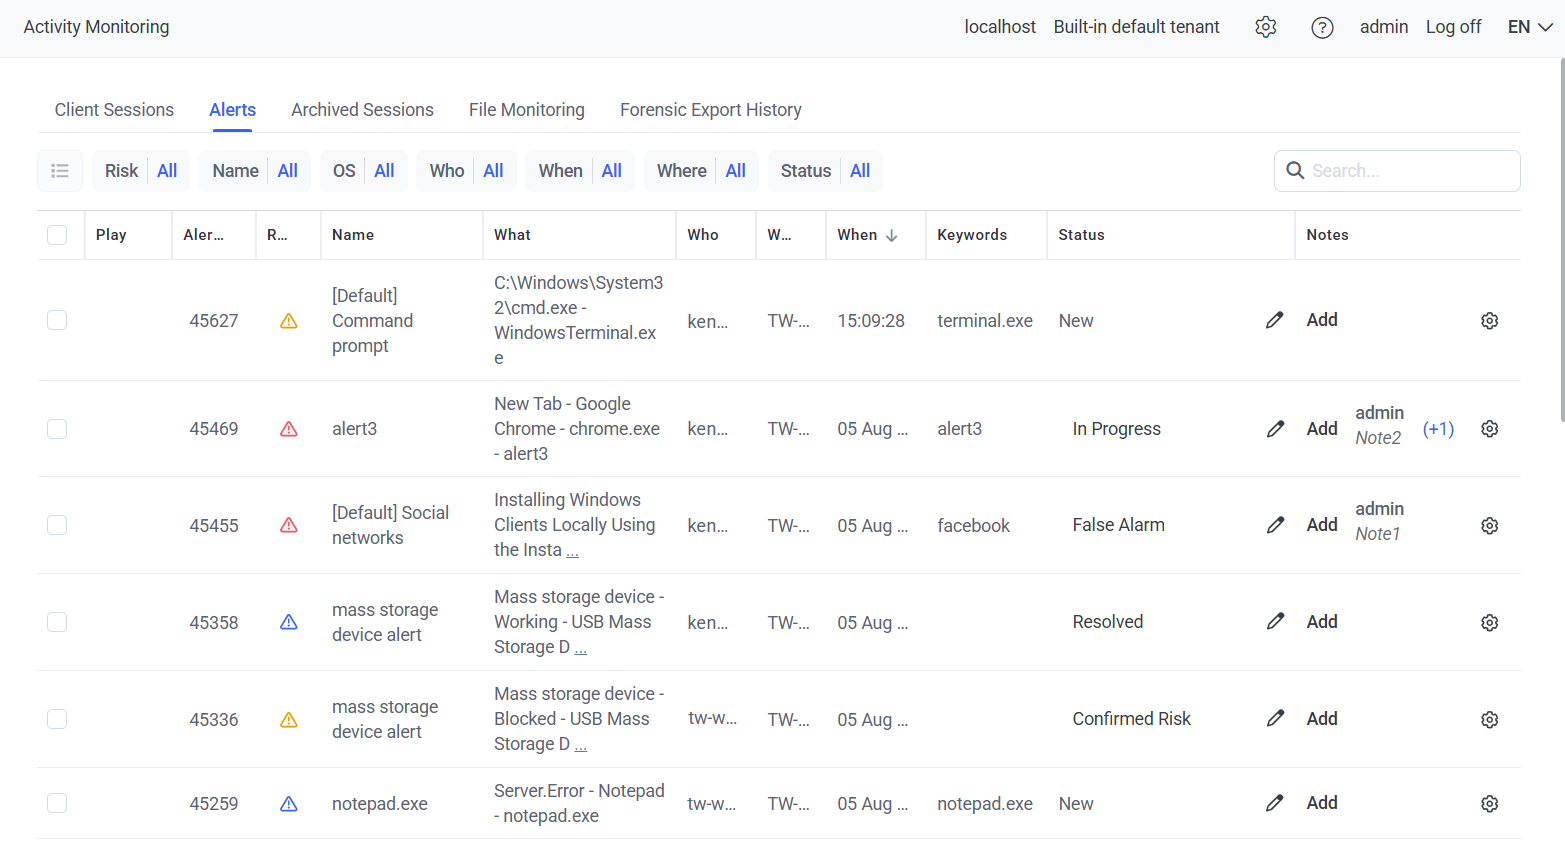
The grid automatically refreshes every 60 seconds.
To search the records, enter a keyword into the Search field (in the top right of the page).
To sort the records, click the required column header. The column sort order can be changed from descending to ascending, or vice versa, by clicking the column header again, and is indicated by the up/down arrow icon in the column header (the records can be sorted by any column except the Description column, and can only be sorted by one columns at a time).
NOTE: If the data is not sorted by a column, the Sort arrow is not shown in the column header.
To adjust the width of the columns, place the cursor over the separator between the required column headers, and drag and drop the separator left or right, as required.
To change the number of records displayed per page (if there are more than 50 alert events), click the Load More button (at the bottom of the page) to display an additional 50 records each time it is pressed.
To filter the alert records displayed in the grid, click the required filter (Risk, Name, OS, Who, When, Where, and Status) at the top of the page, and select one or multiple checkboxes as required (the data can be filtered by multiple filters at once).
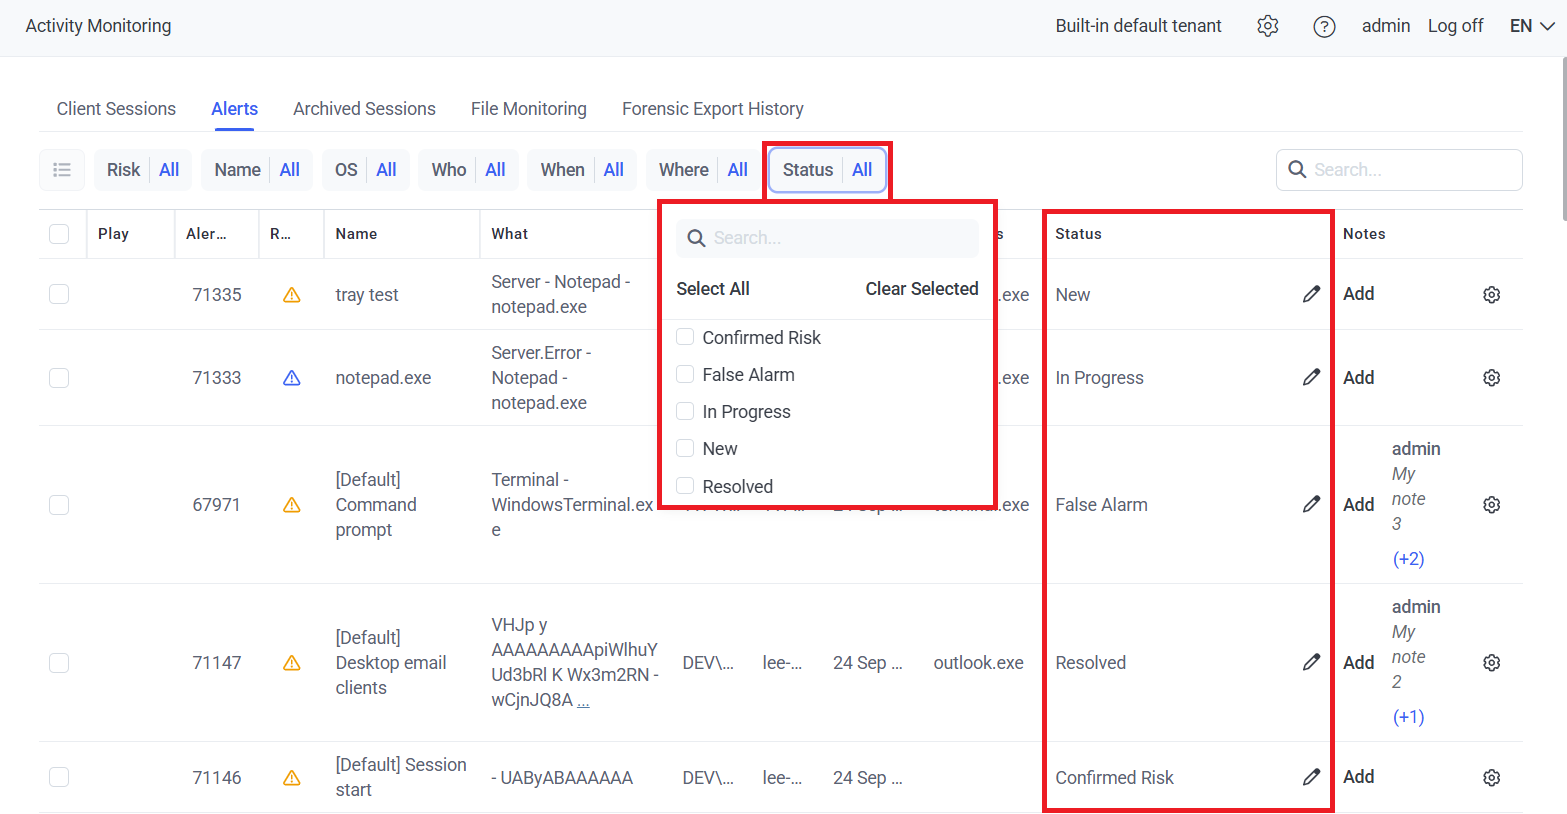
To change the Status of an alert event, click the Edit (
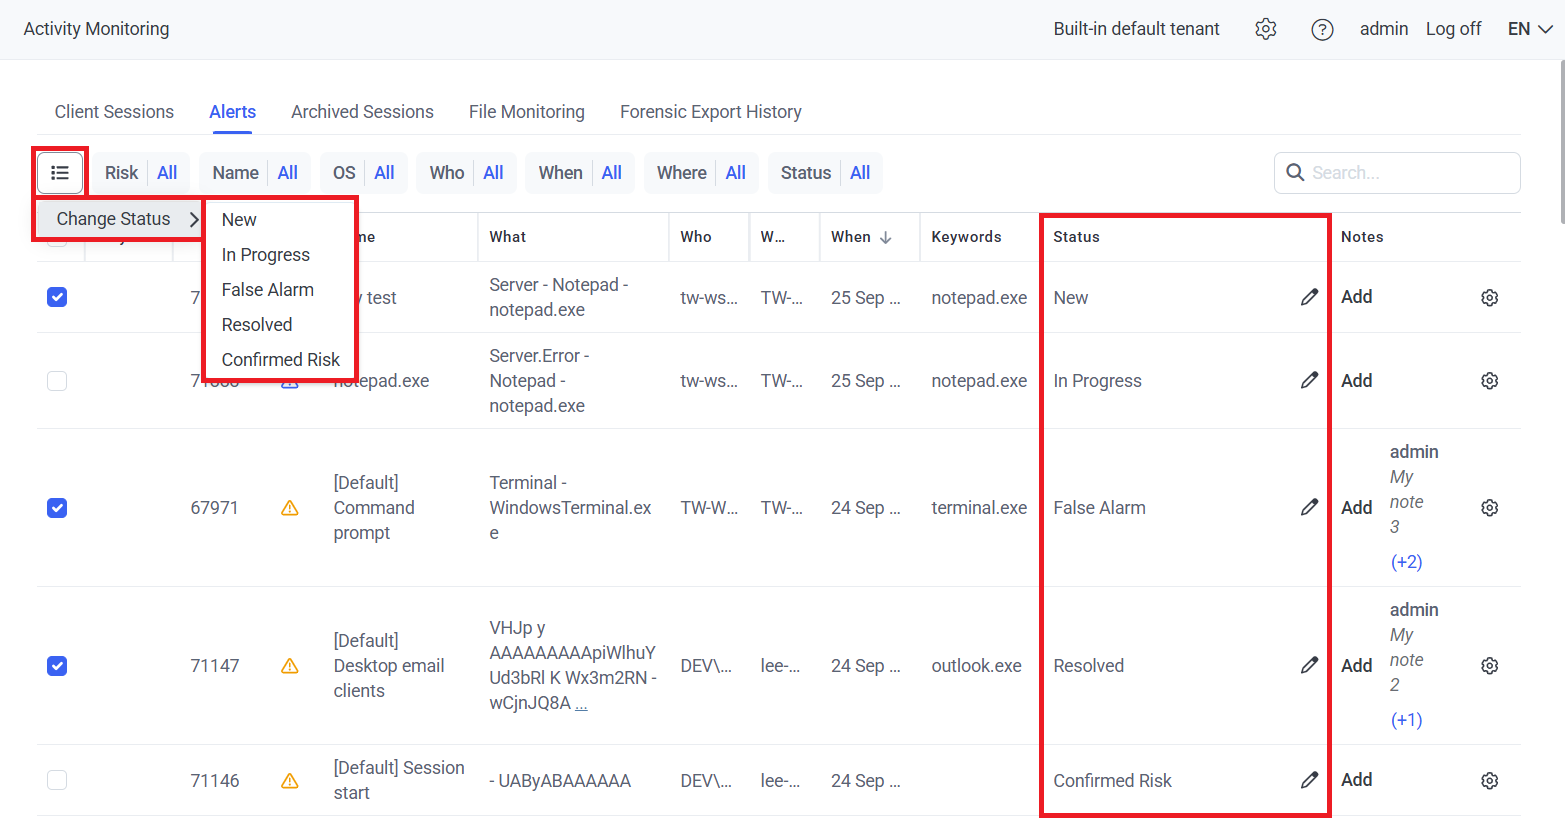
The Statuses of multiple alert events can also be changed simultaneously by clicking the Bulk Action (

To view or add (or remove) Notes about an alert event, click the Add button next to the alert event required, and add (or delete) notes by using the Add a note button (or the Remove (
NOTE: Notes can only be removed by the user who added them (or by the admin user of the system).
